Link is copied
Telegraf
This application is supported by TNA Connect V2 only and requires a V2 Service subscription.
Telegraf is an open-source agent for collecting, processing, aggregating, and writing metrics. It is used to collect different hardware and software metrics about the TNA and send them to evalink talos.
Install and Configure Telegraf
You need to enable Docker before you proceed with the steps below.
Access level 3 or above is required to install and configure Telegraf.
To install and configure Telegraf, do the following:
-
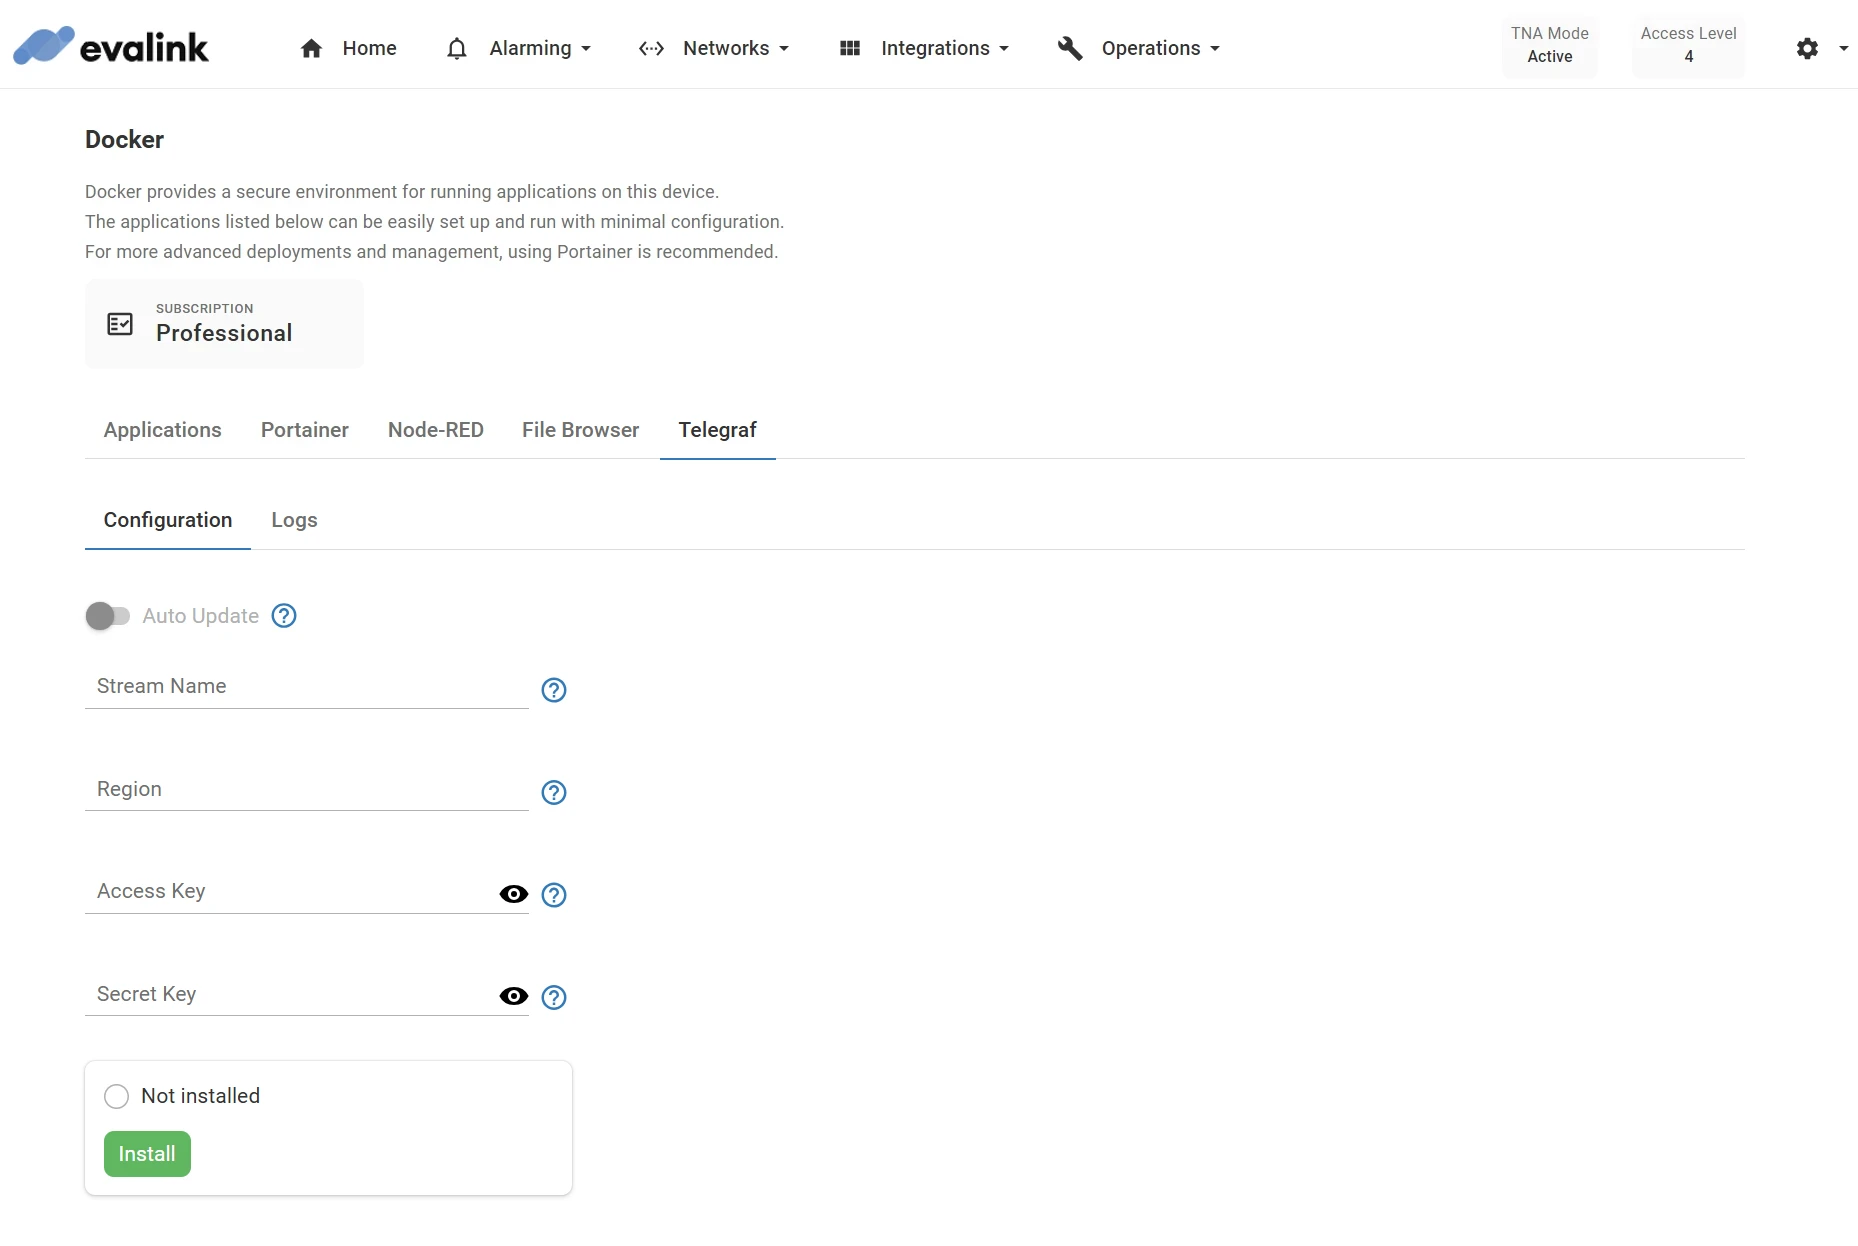
On the TNA Web Server, click on Integrations from the top navigation menu and choose Docker
-
To install Telegraf, go to the Telegraf tab and click on Install under the Configuration tab
Once installed, the state changes from Not installed to Stopped at the bottom of the page, in the Applications tab, and in the Home page.
-
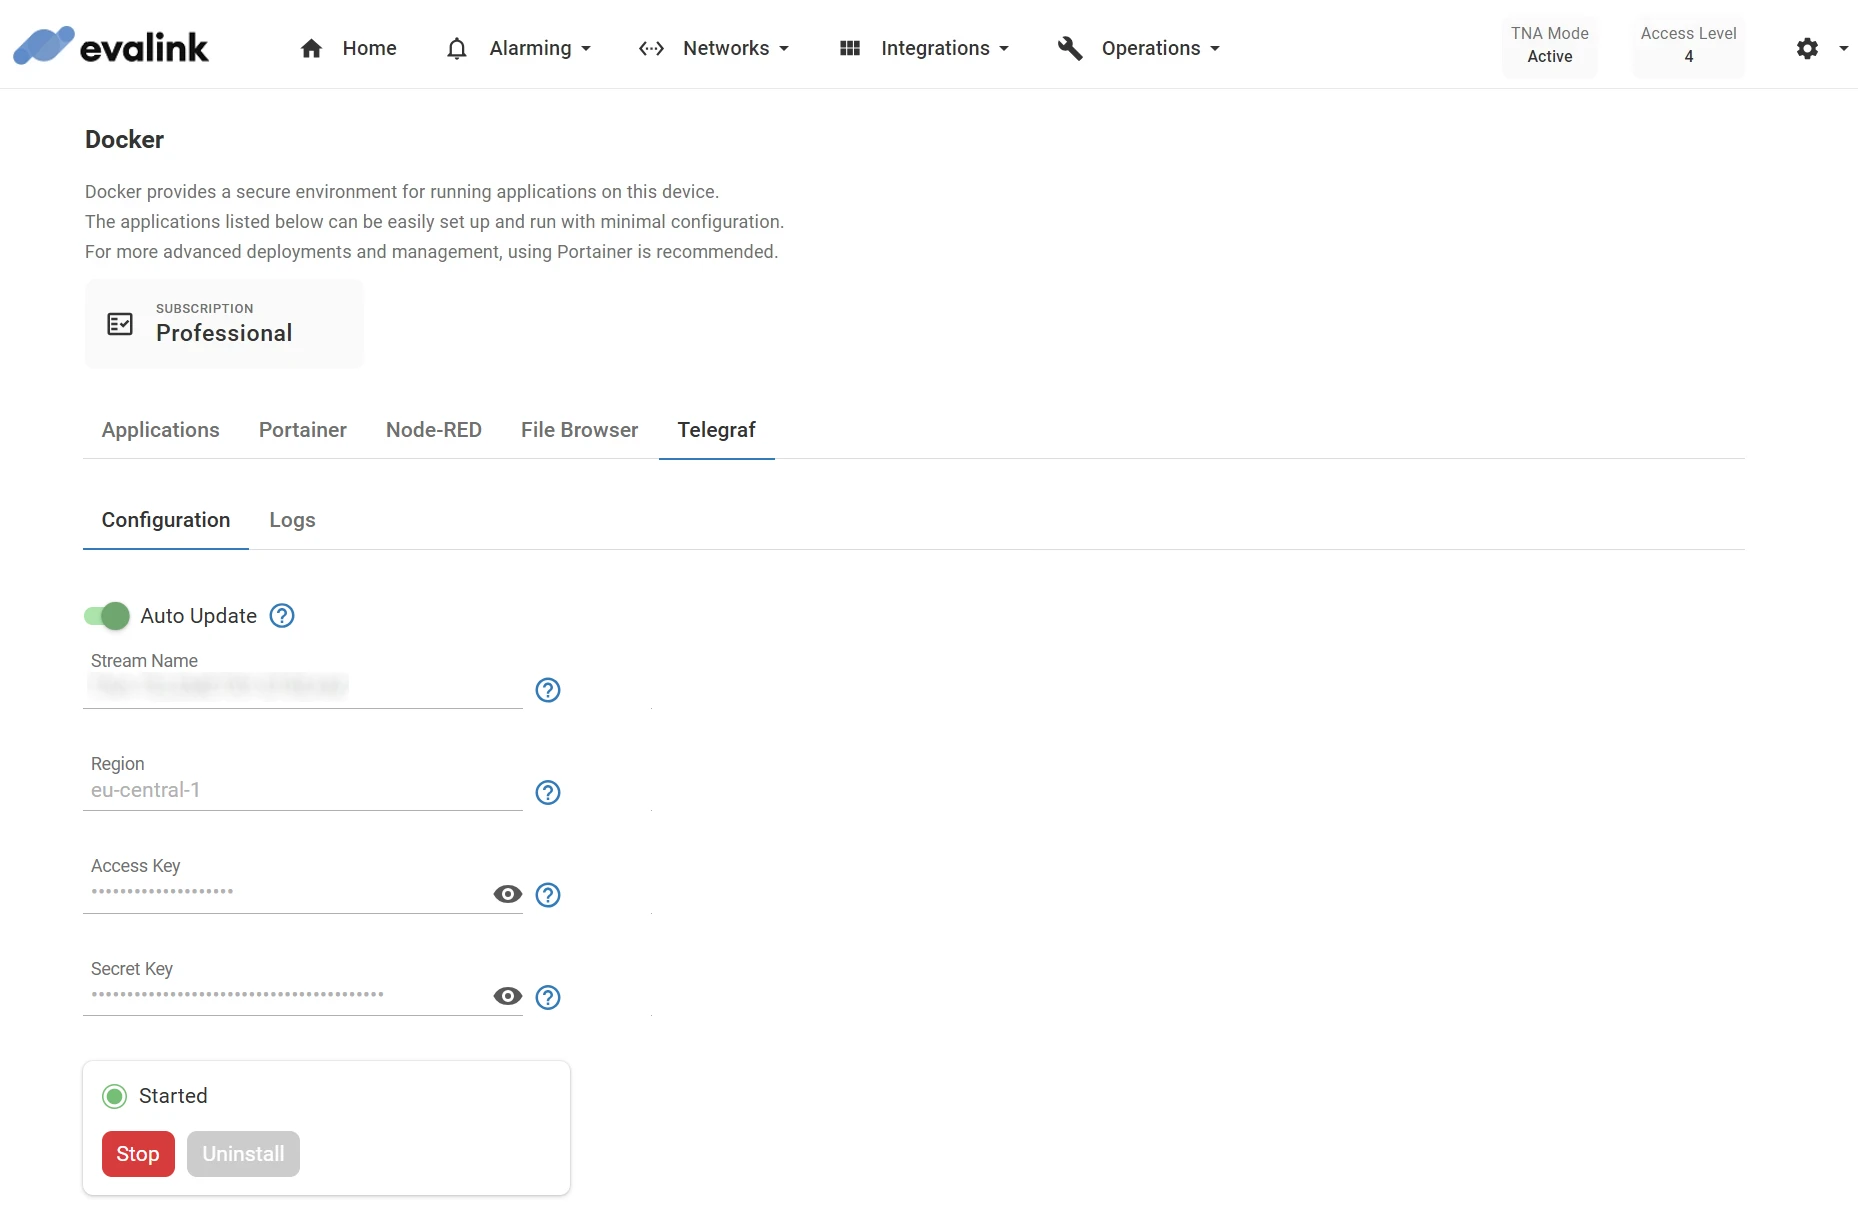
(Optional) Toggle Auto Update to automatically update Telegraf to the latest version after a firmware update
-
Configure the following settings:
| Stream Name | The unique identifier of Kinesis data stream. Maximum: 32 characters Note: The value should not contain spaces or other special characters. |
| Region | The specific AWS geographical area where Kinesis data stream is hosted. Maximum: 24 characters Examples of commonly used AWS Regions and their codes: Europe (Ireland): eu-west-1US East (N. Virginia): us-east-1US West (Oregon): us-west-2Asia Pacific (Mumbai): ap-south-1You can find the full list of AWS Regions in the AWS Regions Table. |
| Access Key | The access key for the IAM user. Maximum: 64 characters |
| Secret Key | The secret key for the IAM user. Maximum: 64 characters |
-
Click on Save
-
(Optional) Click on Undo changes to reset the parameters to their previous values
-
Click on Start to start Telegraf
The state changes from Stopped to Started at the bottom of the page, in the Applications tab, and in the Home page.
-
(Optional) Click on Stop to stop Telegraf
-
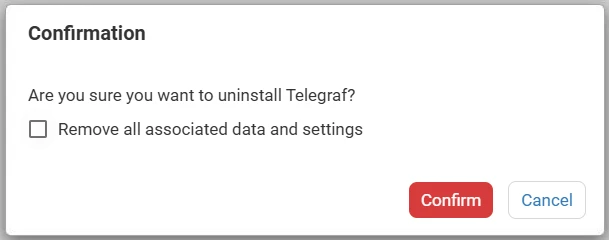
(Optional) Click on Uninstall to remove Telegraf
A confirmation prompt appears. To delete all associated data and configuration, select the checkbox before clicking Confirm. Click Cancel to keep the application.
View Logs
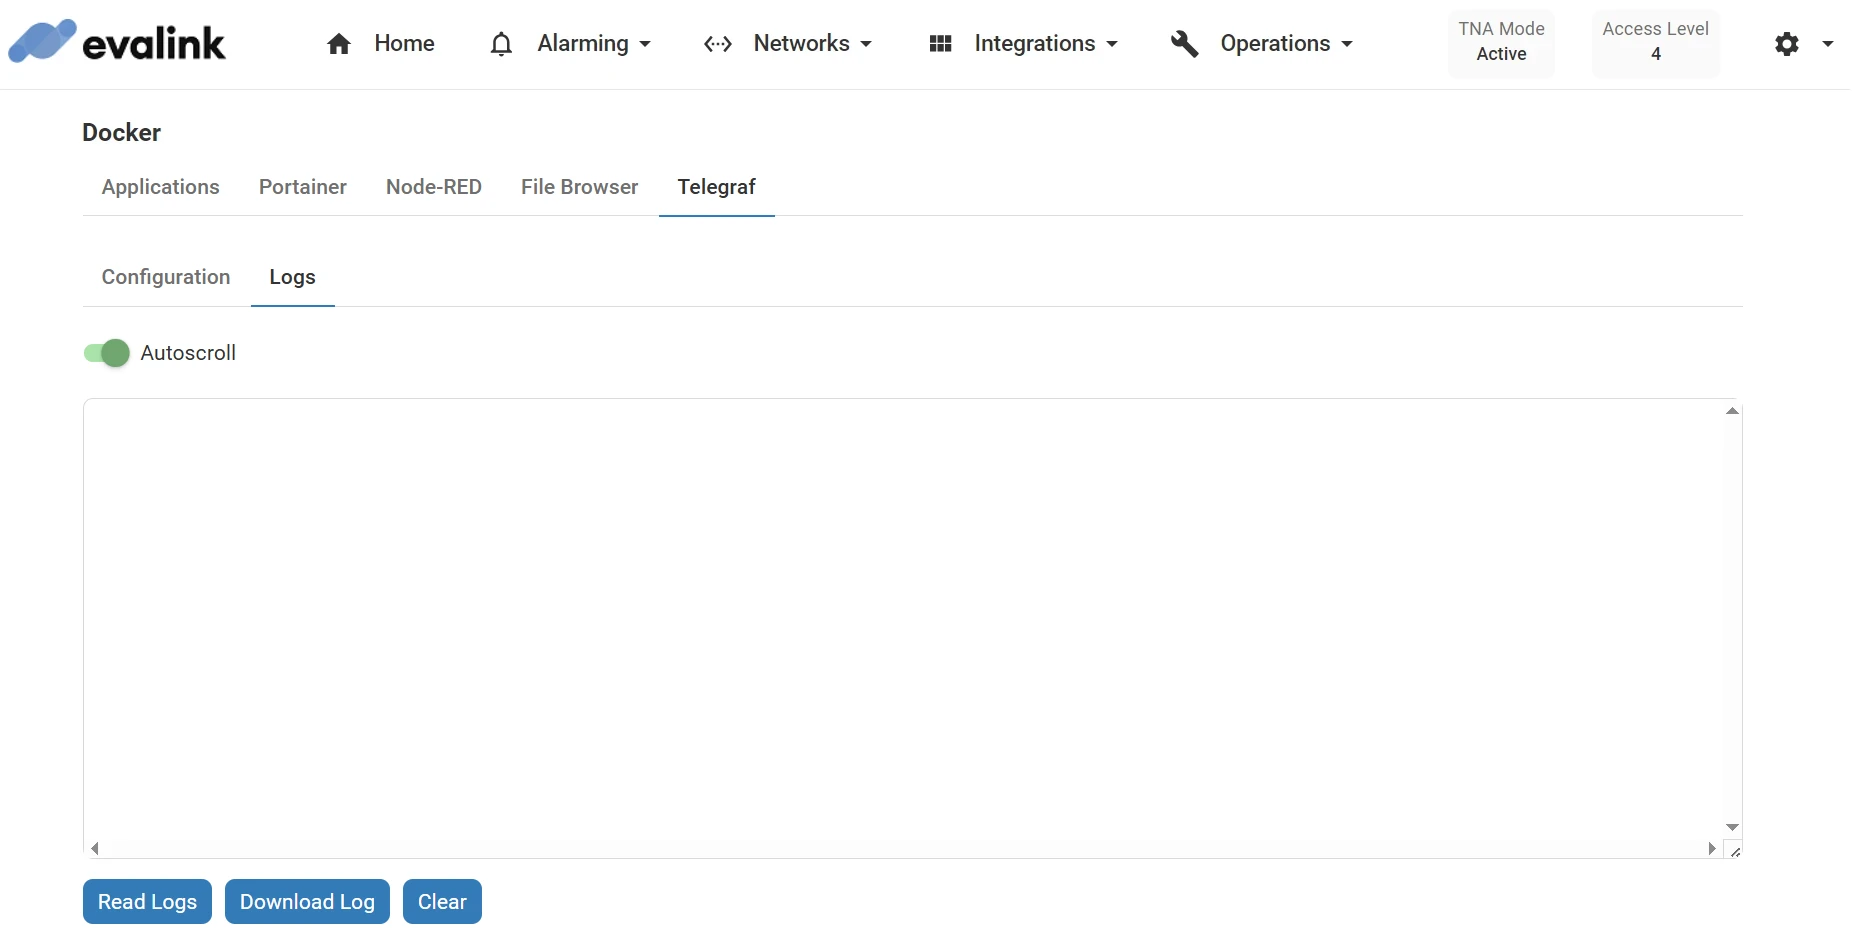
To view the log output for Telegraf in real time and download the full log into a separate file, do the following:
- Under the Telegraf tab, click on Logs
-
Click on Read Logs to display live log data in the text field
Once started, a notification is shown at the lower left corner of the page
-
(Optional) Enable the Autoscroll toggle to keep the latest log entries visible as they update in real-time
-
(Optional) Click on Download Log to download the full log data into a separate file
-
(Optional) Click on Clear to clear the text field
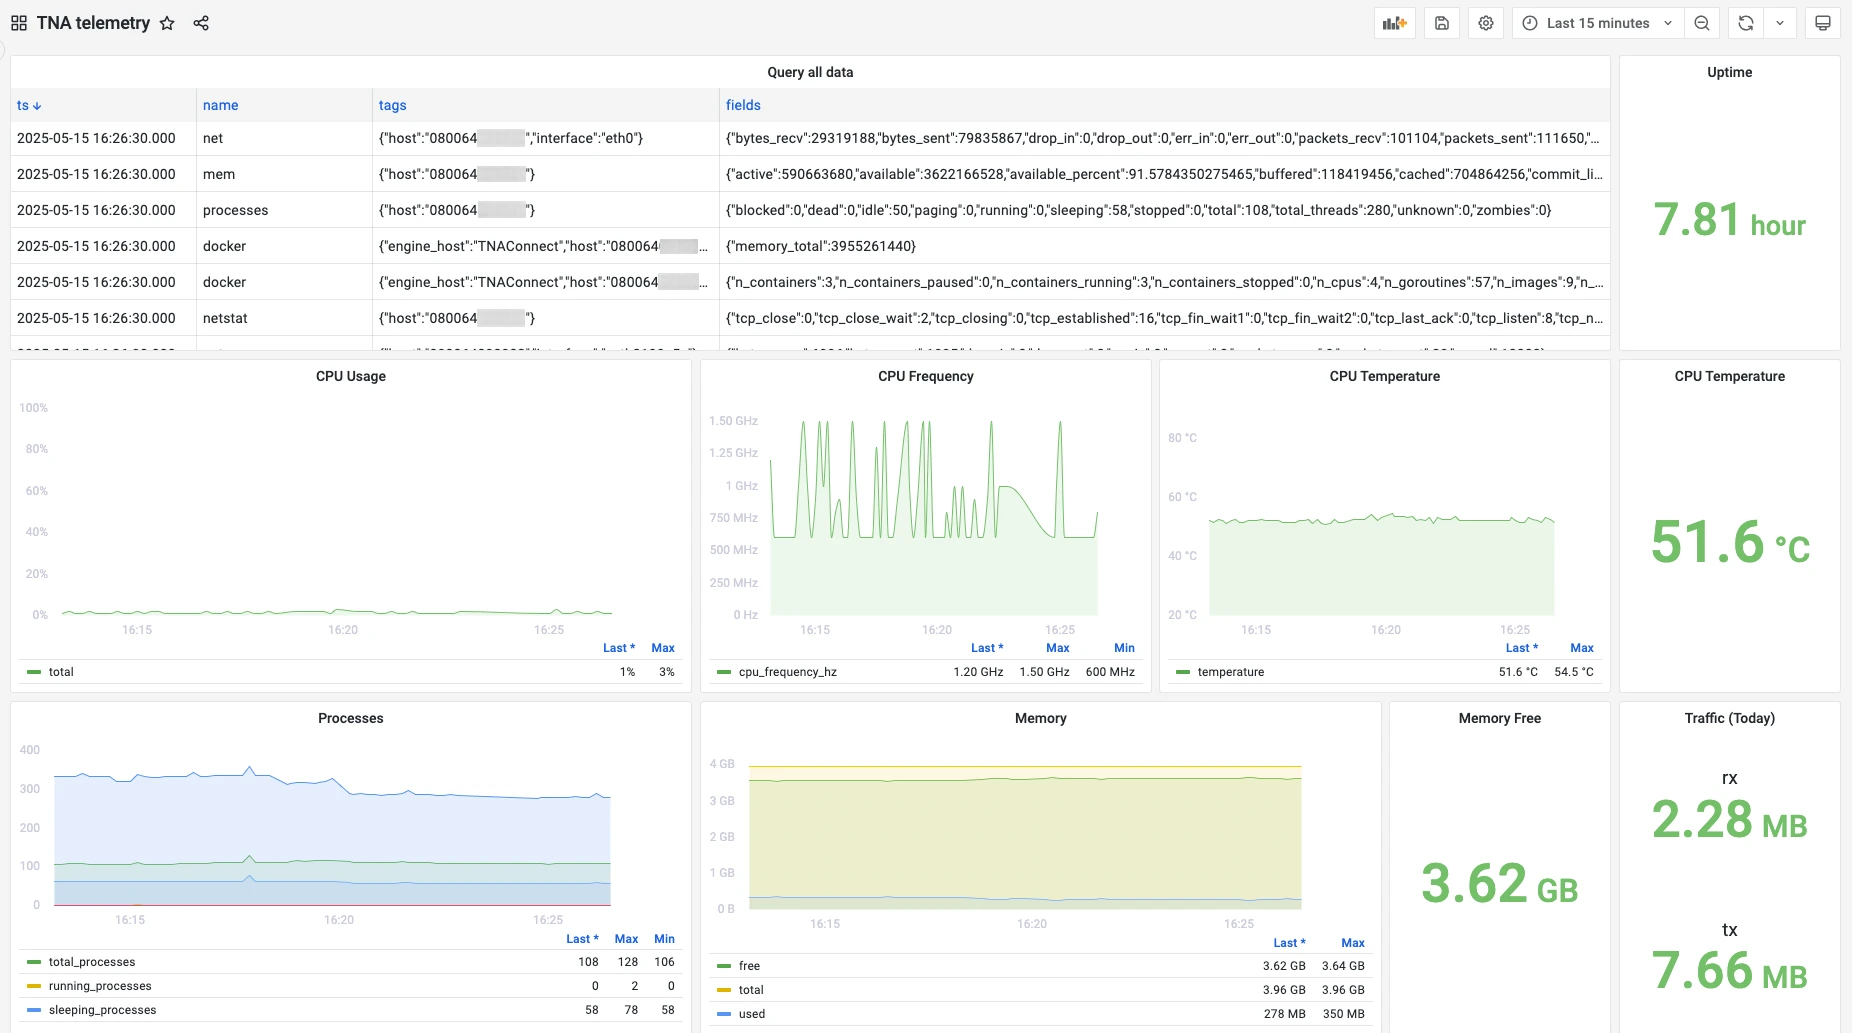
View TNA Metrics
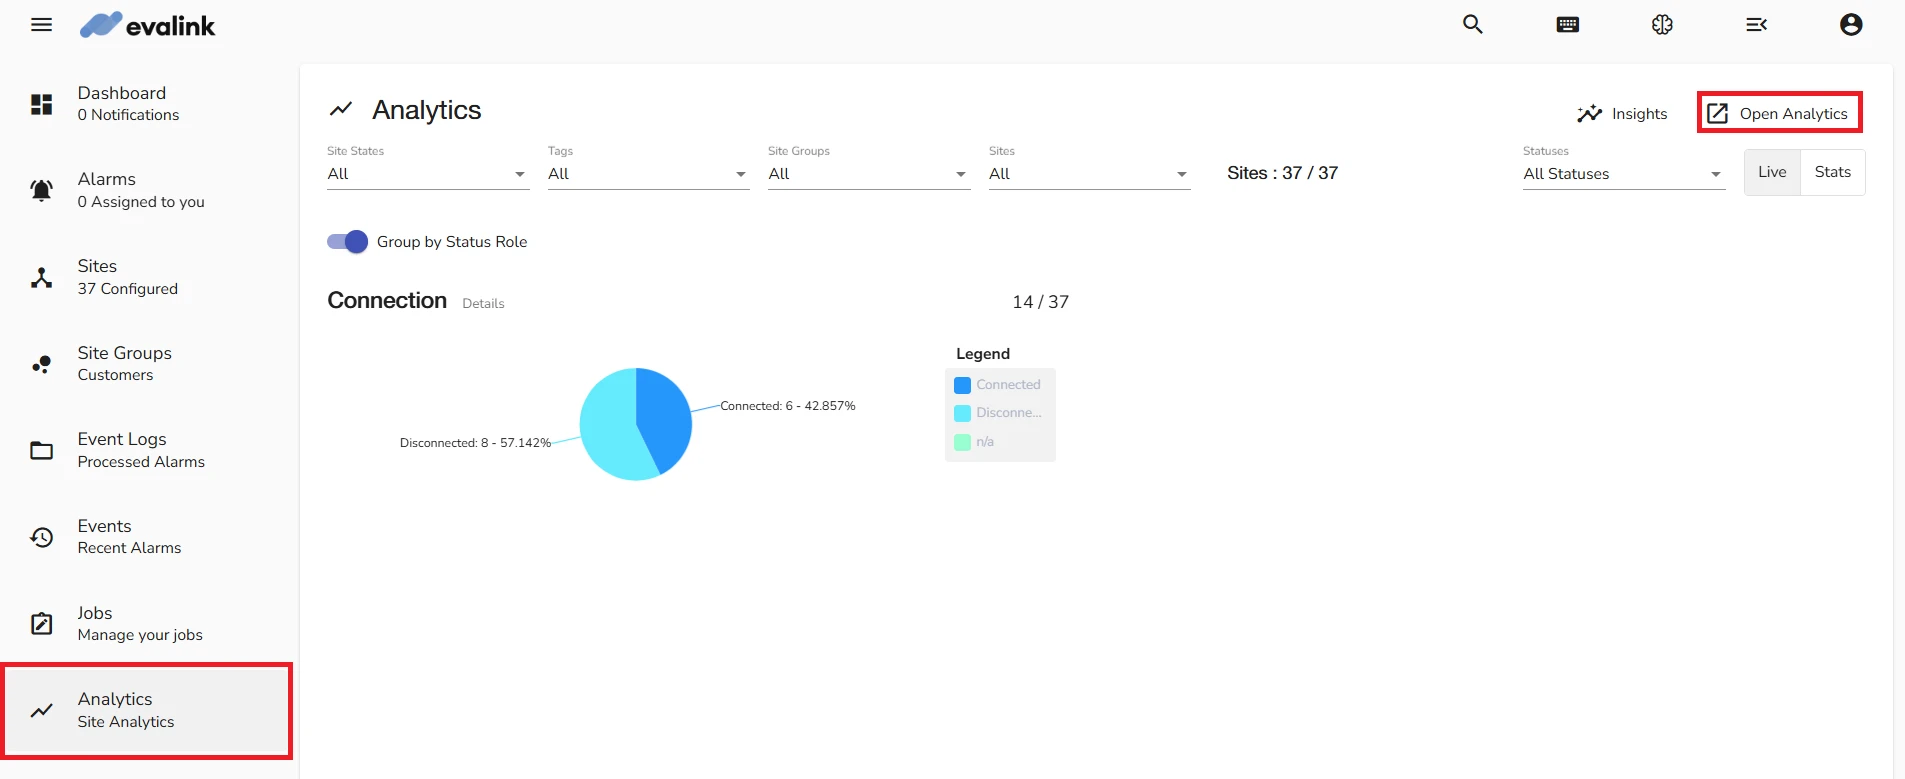
After you configure and start Telegraf, you can view the TNA metrics it collects from evalink analytics:
- On your evalink talos account, navigate to Analytics, then click on Open Analytics from the upper right corner
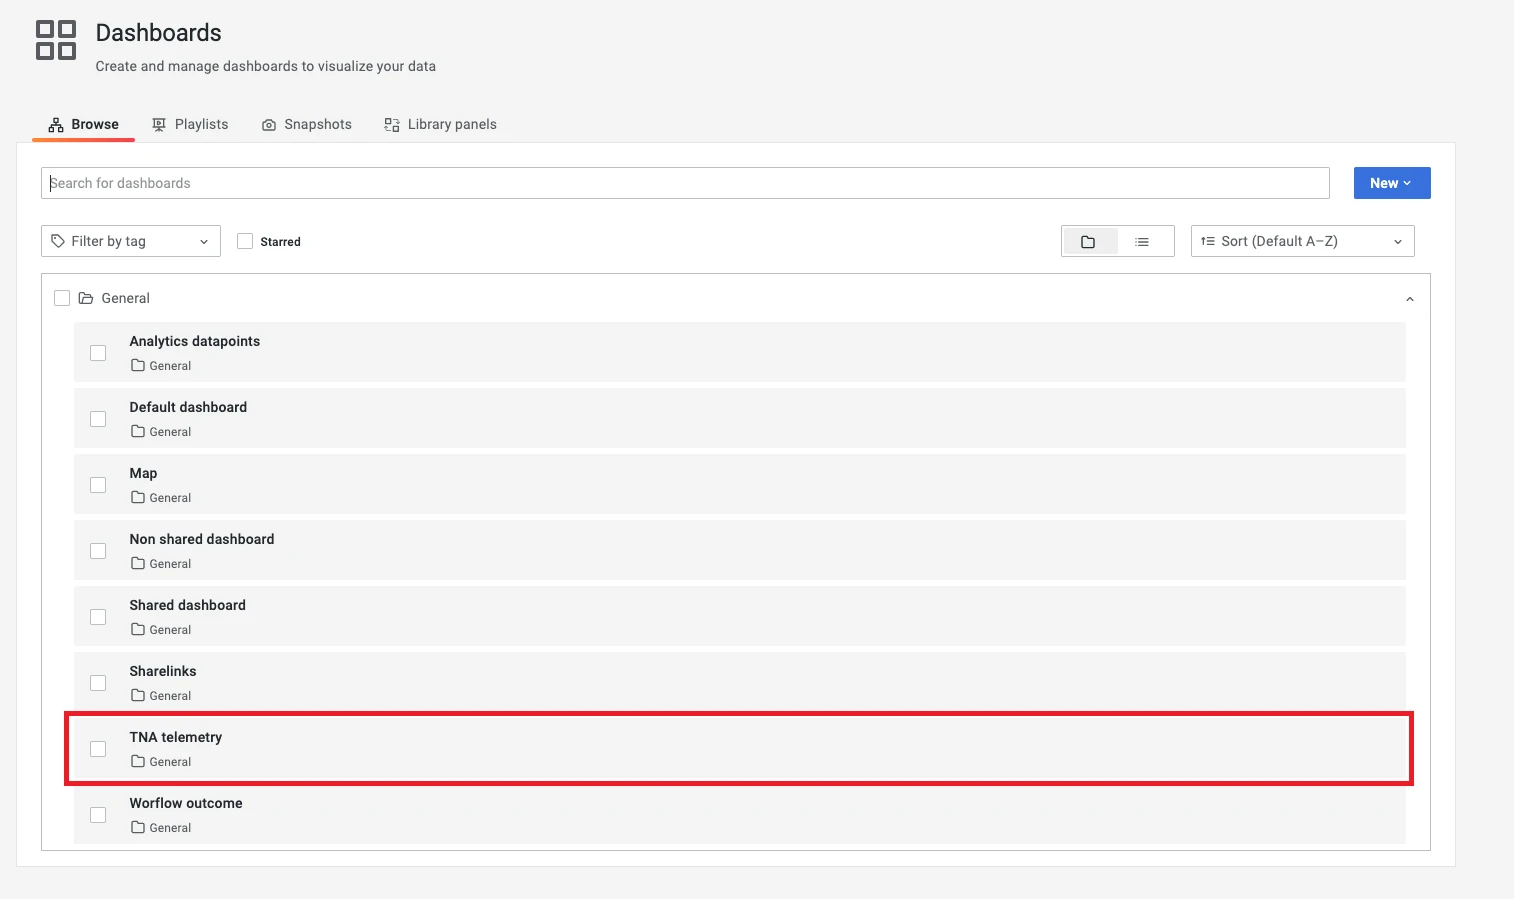
- From the right menu, click on then Browse to list the available dashboards
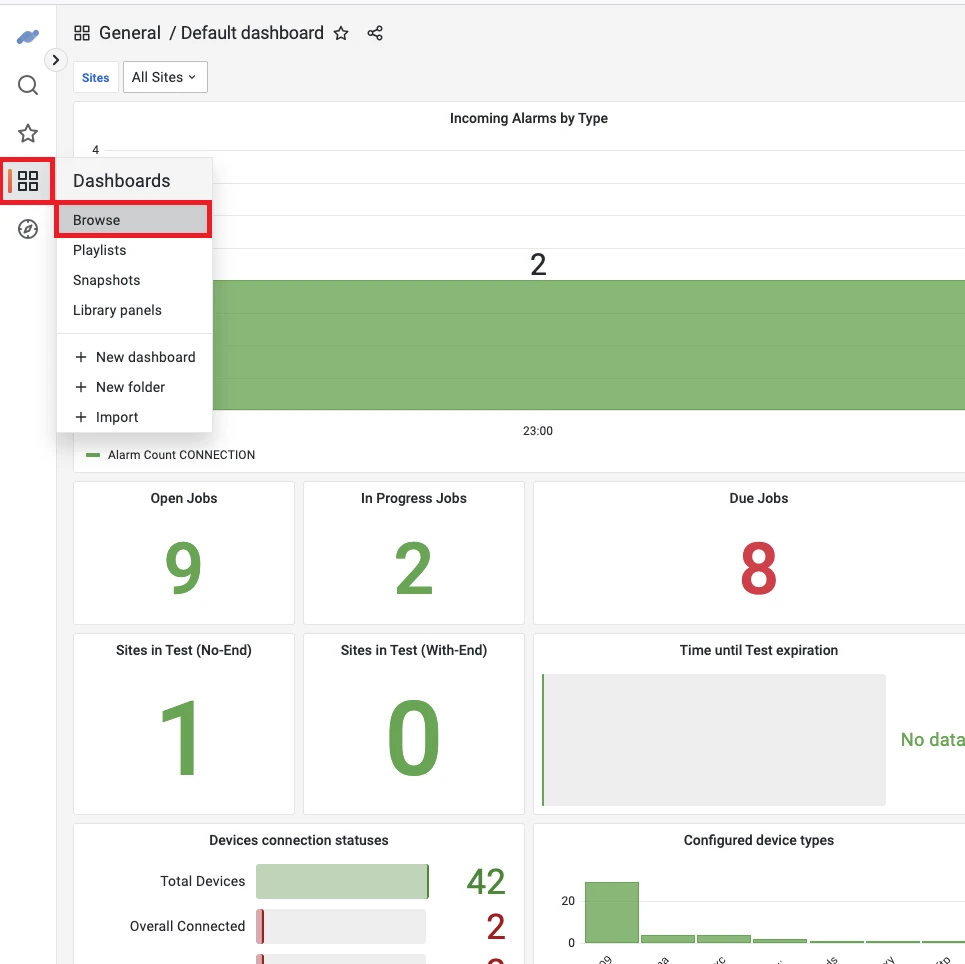
- From the listed dashboards, select the TNA telemetry dashboard to view it